
In this article, I’m going to show you how to make a Rain Gauge that communicates with Home Assistant via Zigbee. The best part is that all you need is any 3D printer, a few screws, and a Zigbee door sensor. I prefer the one from Aqara, but any other similar-sized sensor should work just fine.
Honestly, that’s all! There are no wires, no custom PCBs, no need for soldering, and no holes to drill!
Video version
Source files
The project is totally open-source, which means you can grab it and tweak it however you please. You can snag my design, the PCB layout, the 3D model, the bill of materials, and firmware – and make it exactly as is. Or, you can use it as a jumping-off point, make changes, and whip up something totally fresh.
Electronics
The sponsor of this project is JLCPCB. They made that beautiful board for all my projects.
For a few bucks, and in a matter of days, you can have a professional PCB on your deck, ready to solder 🙂 Now, for new users, they provide up to $54 sign-up coupons.
And if you don’t feel up to it, they can solder all SMD components for you as well.
In this case, the electronics boil down to purchasing the Aqara Door Sensor (Aliexpress). There are no custom boards that need soldering later on. 🙂
Assembly
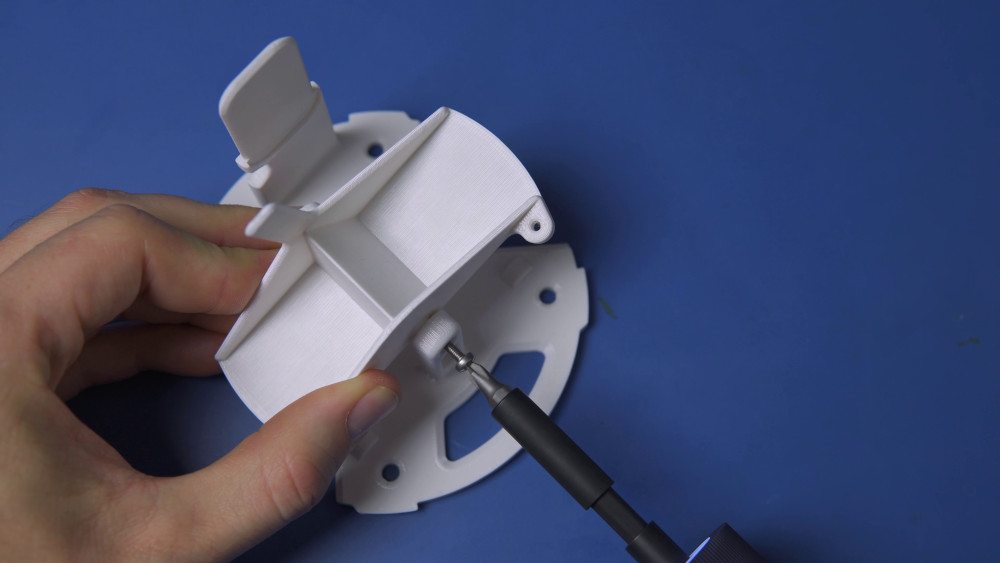
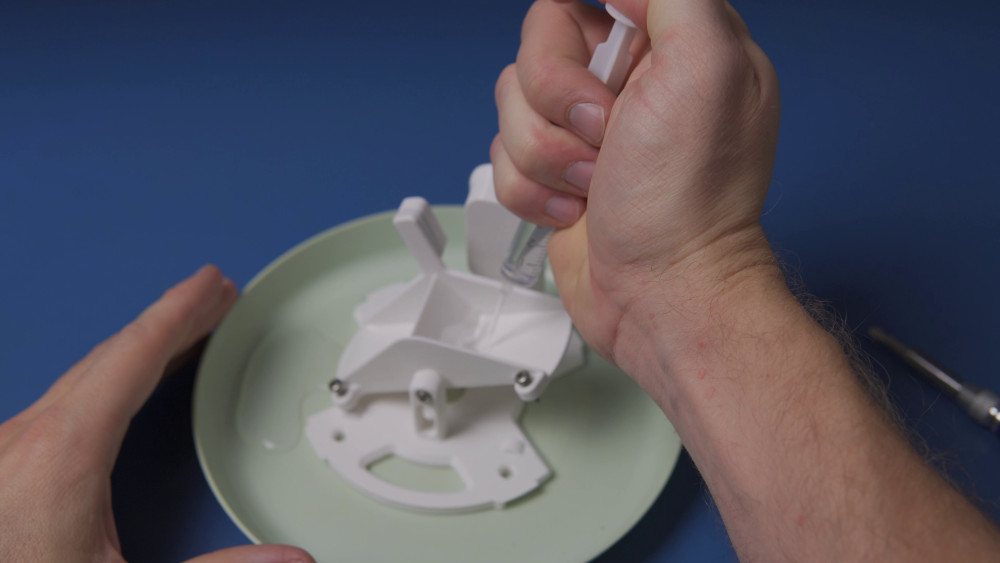
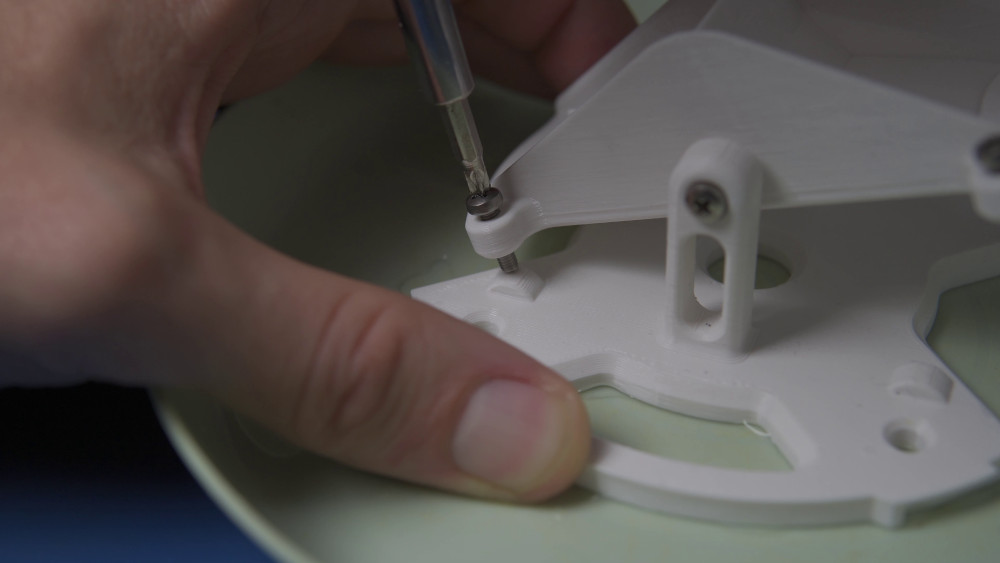
Start by attaching the tipping bucket with two screws.
In the original Rain Gauge, I used a metal rod as axle and teflon tubes to reduce friction.
In this version (to simplify the design), I used common 3mm screws.
This will surely have “some” impact on longevity, but I don’t expect it to be significant.
And even if the axle hole wears out after 5 years or so, you can print it again within 2 hours.
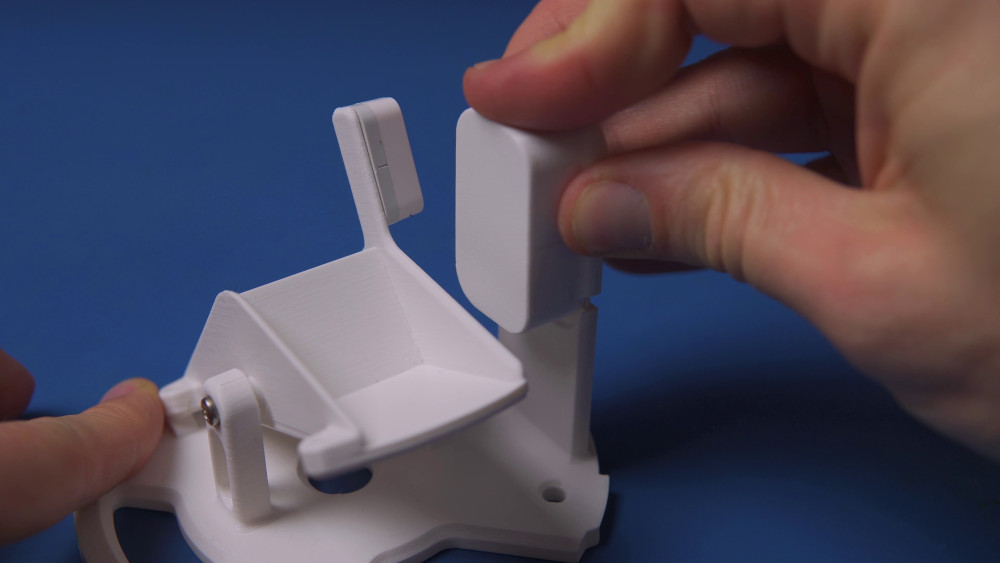
Now, affix the magnet to the top of the tipping bucket.
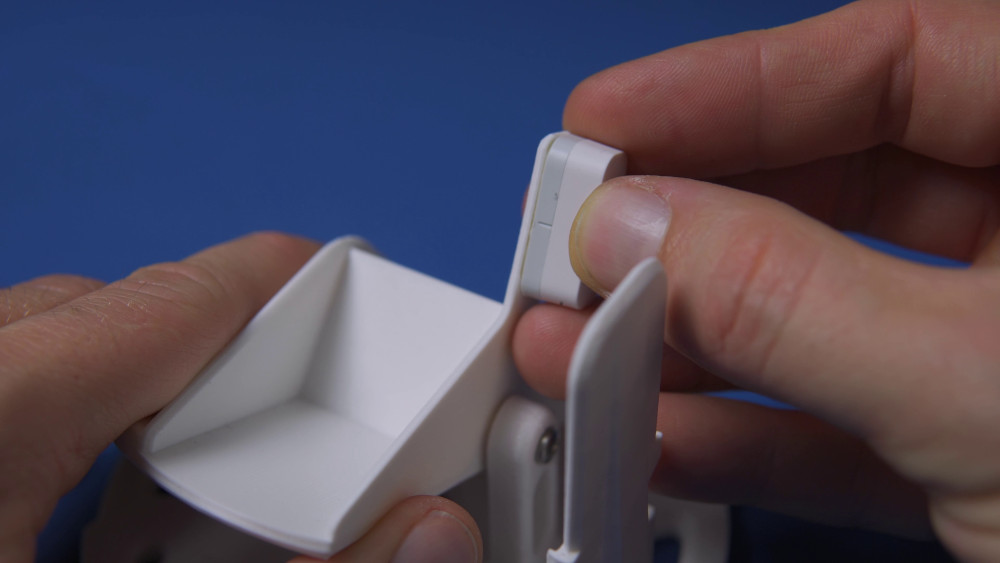
Then insert the sensor into this “cover” (make sure that these two indicators align).
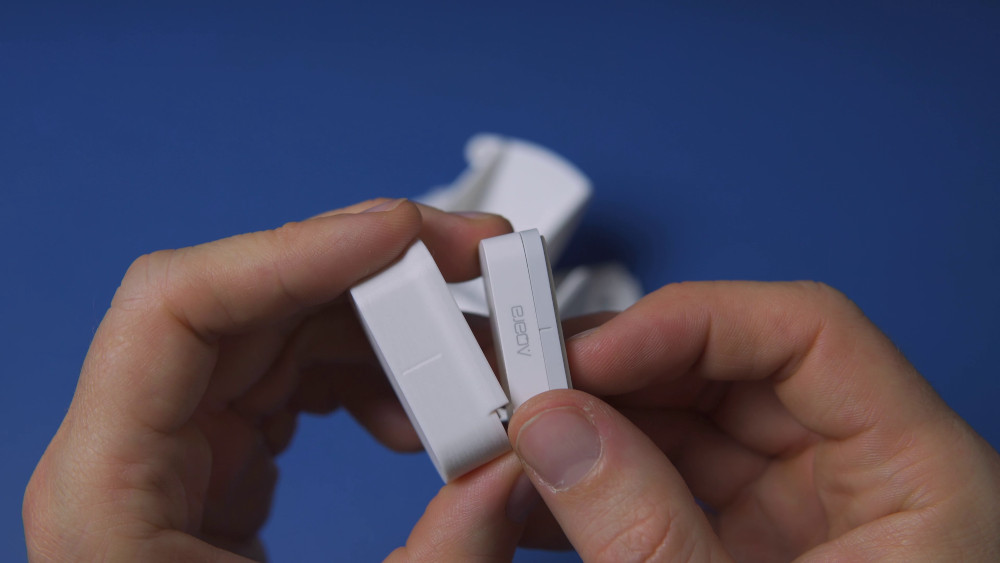
Slide it on that “stick”.
You don’t need to glue or screw it, it holds well on its own.
All that’s left is to attach the funnel and the protective mesh, but we’ll do that after installing the Rain Gauge in its final location.
Calibration
This process is quite straightforward. Simply pour a specific amount of water into the bucket and turn the designated screw until the cup tips over.
Some Math
We need to start by calculating the amount of rainfall represented by one tilt of the cup.
For this, we need two things: the diameter of the funnel’s inlet and the amount of water that causes the cup to overflow. While the first thing is constant (r = 55mm), you have control over the latter.
As I mentioned in one of the previous chapters about calibration using two screws, you can modify the required amount of water. For further calculations, I’ll assume it’s v = 5ml.
A_f = \pi r^2  \approxeq 9503,32mm^2 \\
k = 1000000/P_f \approxeq 105,23 \\
A = k * v = 0.52615l/m^2
where:
P_f-~the~cross~sectional~area~of~the~funnel's~inlet\\
k-~the~ratio~of~square~meters~to~the~surface~area~of~the~funnel\\
A-~volume~of~one~tick~of~the~tipping~bucket
That’s all. Pretty simple, right? 🙂
One tilt of the cup means that exactly 0.52615 liters per square meter have fallen, and since 1 mm is equivalent to 1 liter per square meter, one impulse corresponds to 0.52615 mm of the “water column”.
Integration with Home Assistant
Pierwszym krokiem jest dodanie Door Sensor do Home Assistant. Procedura jest zależna od tego czy używasz dodatku Zigbee2Mqtt czy ZHA (osobiście polecam to drugie).
Na Youtube i w Google znajdziesz mnóstwo tutoriali jak to zrobić dlatego je już sobie ten temat dopuszczę. Skupię się na przekształcenu prostej binarnej zmiennej na faktyczną ilość opadów.
The initial step involves incorporating the Door Sensor into Home Assistant. The process hinges on whether you’re utilizing the Zigbee2Mqtt extension or ZHA (personally, I lean towards the latter).
On platforms like YouTube and Google, a myriad of tutorials await discovery on how to accomplish this, thus I’ll bypass this topic. My focus will pivot towards transmuting a simple binary variable into an actual rainfall quantity.
Configuration
We inscribe everything within the configuration.yaml file.
First, let’s add two sensors that detect the number of bucket tips over the last… You can choose any time period you like. However, for the sake of this tutorial, let’s assume it will be 24 hours.
sensor:
  - platform: history_stats
    name: "Aqara Rainsensor flips/on"
    entity_id: binary_sensor.lumi_lumi_sensor_magnet_aq2_opening
    state: "on"
    type: count
    start: "{{ now() - timedelta(hours=24)}}"
    end: "{{ now() }}"
  - platform: history_stats
    name: "Aqara Rainsensor flips/off"
    entity_id: binary_sensor.lumi_lumi_sensor_magnet_aq2_opening
    state: "off"
    type: count
    start: "{{ now() - timedelta(hours=24)}}"
    end: "{{ now() }}"
Given that the Rain Gauge has two stable states, we need to incorporate two sensors capable of detecting a “tick” – the bucket’s overflow.
– entity_id: this is the name of our entity when adding the Zigbee Door Sensor to Home Assistant.
– state: it references the state to respond to. For one sensor, it ought to be “on,” whereas for the other, it should be “off.”
– type: its function is merely to count the number of such events. Therefore, we opt for “count.”
– start/end: here, we are defining the time frame within which the sensor should tally events. Given that we want a continuous process, we can employ the “timedelta” function. This notation implies that the sensor begins counting from 24 hours ago. This is not a rigidly set specific time, ensuring the result always pertains to the last 24 hours. Analogously, you could set it to 1 hour, 30 days, or even a year.
The next step entails incorporating a template that will consolidate the aforementioned results and convert them into liters per square millimeter.
template:
  - sensor:
      - name: Rainfall [day]
        state_class: measurement
        unique_id: rainfall_day
        unit_of_measurement: mm
        icon: mdi:weather-pouring
        state: >-
          {% set count = (states('sensor.aqara_rainsensor_flips_on') | int(0)) + (states('sensor.aqara_rainsensor_flips_off') | int(0)) %}
          {% set mm = count * 0.52615 %}
          {% if count >= 0 %}
            {{ mm|round(1, 'floor') }}
          {% endif %}
We’re making a sensor template that aggregates all the tips of the bucket, subsequently multiplying them by a value we’ve calculated earlier: 0.52615.
I’m also rounding off the value to one decimal place.
Dashboard
On the subject of configuration, that’s all sorted. Now, all that’s left is to present these measurements on the dashboard in an agreeable way. I’m partial to a column chart illustrating the rainfall over the past two weeks.
type: custom:mini-graph-card
icon: mdi:weather-rainy
name: Opady
aggregate_func: max
hours_to_show: 360
group_by: date
show:
  graph: bar
  fill: true
  icon: false
color_thresholds:
  - value: 12
    color: '#030ffc'
  - value: 7
    color: '#353ffc'
  - value: 5
    color: '#656dfc'
  - value: 3
    color: '#979dfc'
  - value: 1
    color: '#afb3fa'
  - value: 0
    color: '#ffffff'
entities:
  - entity: sensor.rainfall_day
    state_adaptive_color: false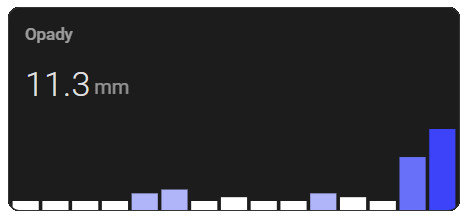
As you can see, I’ve incorporated a color variation that corresponds to the intensity of the rainfall. The harder it rains, the more prominent the blue hue becomes on the chart.
Summary
And that wraps it up. Now, all you need to do is wait for the rain and gather data for the chart 🙂
If you have any questions, feel free to reach out at contact@smartsolutions4home.com.
Related Articles

SS4H-SSR Smart Extension Board – DIY project based on ESP8266
With these kinds of projects, they are often created when…

SS4H-SHH Smart Home Hub based on ESP32 POE
Personally, I’m a fan of centralized “smart” systems. Thanks to…

SS4H-SD Smart Doorbell – DIY project based on ESP32
You surely know this feeling when the doorbell rings while…